VS Code extension
riSim Studio user manual
The extension “riSim Studio” adds the riSim view to the activity bar, with the Testbenches sidebar, and starts riSim in the background as soon as a workspace folder has a risim-config.toml at its root.
The Testbenches sidebar
The sidebar lists the testcases detected in the workspace.
With several workspace folders, it lists the folders with a risim-config.toml, each with its testcases.
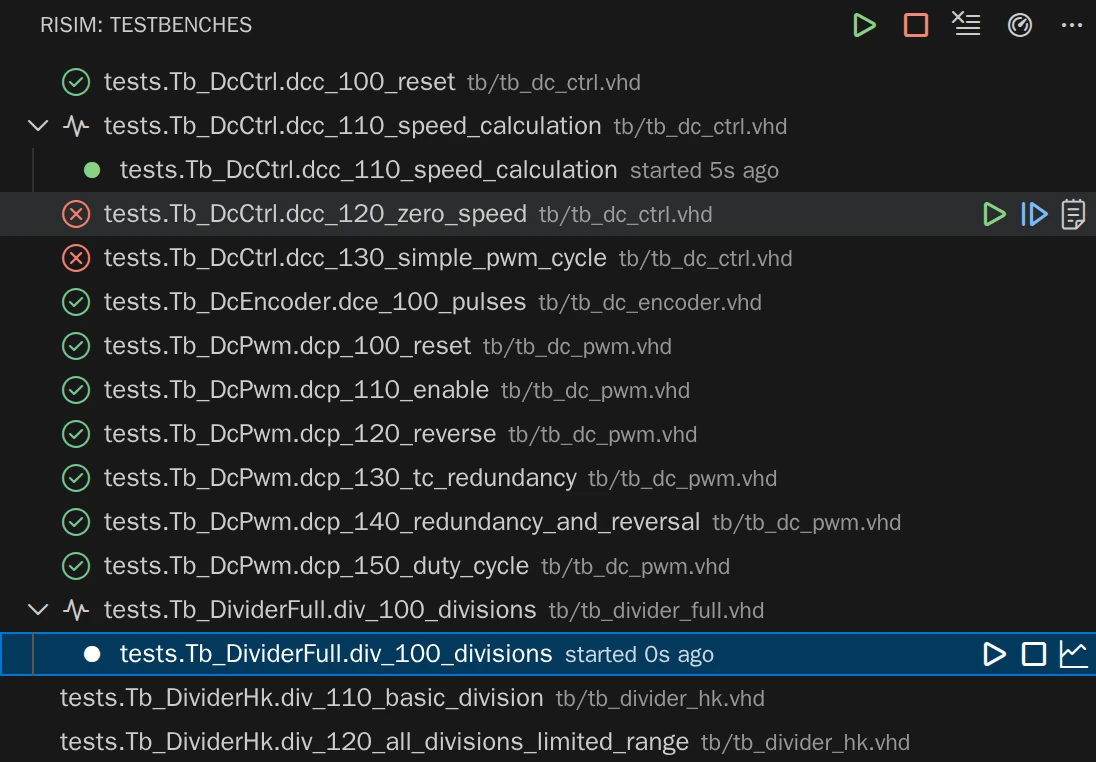
- The icon of a testcase shows the result of its last run, passed, failed, or cancelled, and a pulse while it runs.
- Clicking on a testcase opens its file.
- , the run button that shows when you hover over a testcase, compiles the source files and runs the simulation.
- starts it in paused mode and opens a waveform view.
- opens the log output from the last run.
A testcase with an active simulation offers additional options:
- runs a paused simulation, pauses a running one, and stops it.
- shows the simulation in a waveform view.
From the sidebar’s title bar, schedules a simulation for each testcase, stops all active simulations, and clears all stopped or finished simulations. opens the dashboard.
The status bar
The riSim item in the status bar shows whether VS Code is connected to riSim, and the plan:
- a plug while it is connected, with
riSimon the free plan,riSim Pro Trialon a trial, andriSim Proon a paid plan; - a warning sign at the end when the license can’t be used, or has a warning;
- instead of the plug, a spinning icon while it connects, and an error sign when it can’t.
Waveforms
A waveform view shows the signals of one simulation while it runs. It has the hierarchy pane on the left, the signal list with the values at the cursor, and the waveforms.
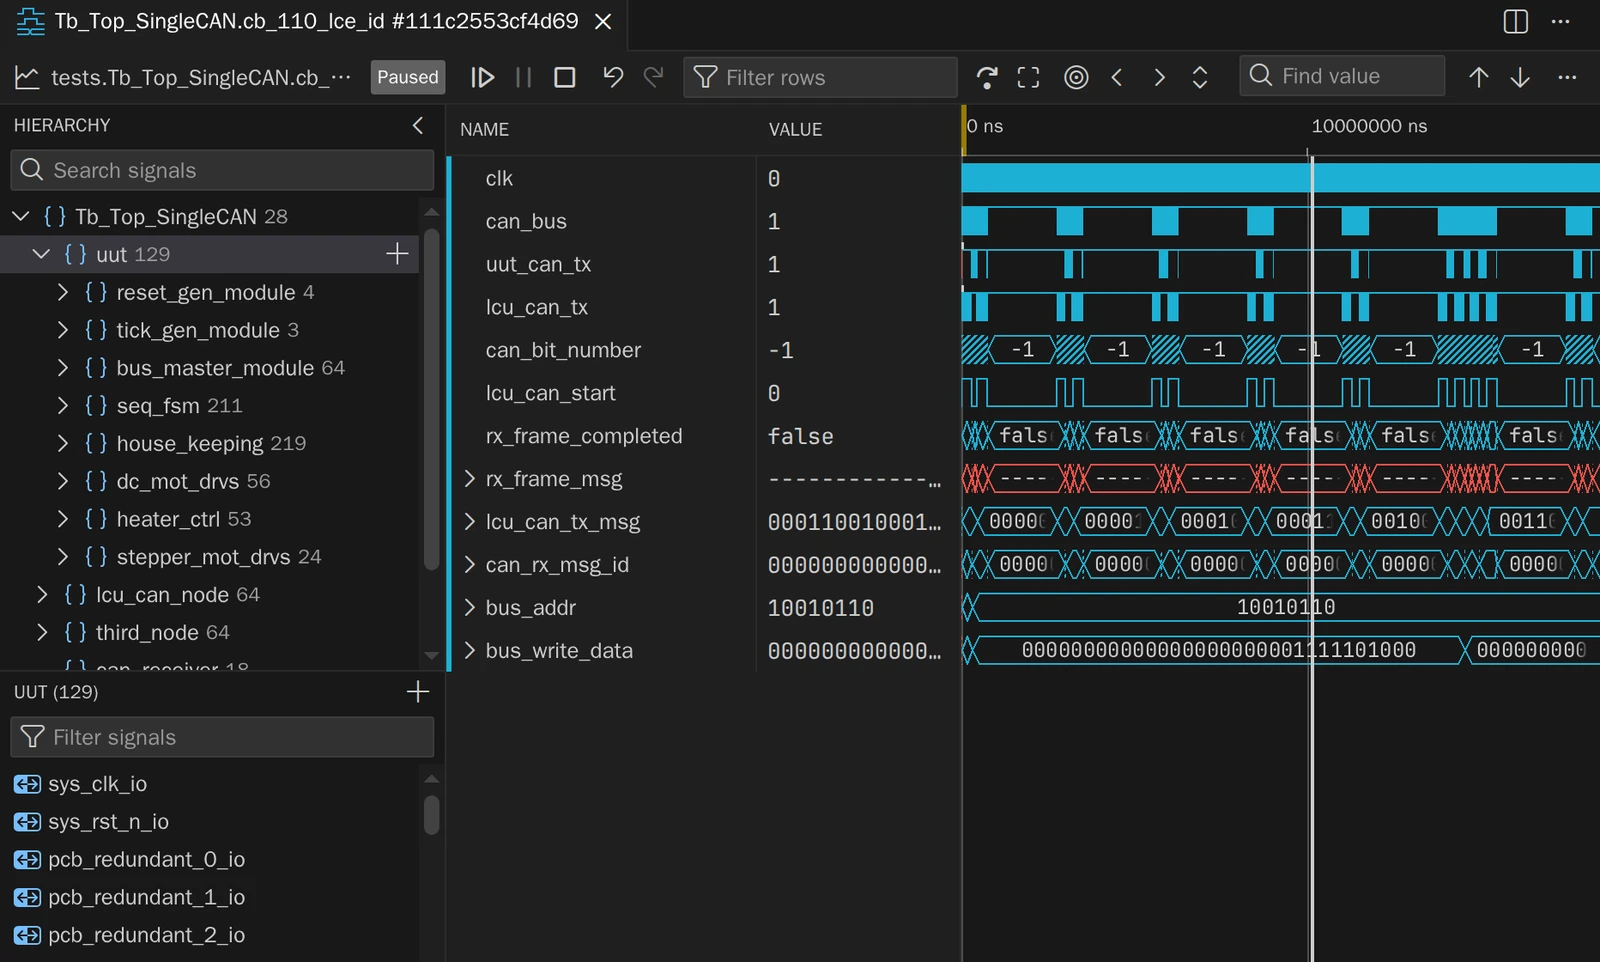
Opening a view
- on a testcase, in the Testbenches sidebar or the dashboard, starts its simulation paused at time 0 and opens a view.
- on a simulation shows its most recently used view, or opens one; New Waveform View always opens another.
Multiple views can be opened for the same simulation, including while the simulation is already running. When is activated, a view automatically switches to the next run of its testcase, with the same signals and configurations.
Running and pausing
The toolbar’s , , and buttons control the simulation; stopping asks first.
A paused simulation keeps its simulation thread.
A simulation started in paused mode pauses again when the VHDL std.env.stop procedure is called, instead of ending.
Adding signals
The hierarchy pane has the scopes of the design, and below them the signals of the selected scope, with a filter field:
- Select signals and click , press Enter, or double-click them.
- , at the top of the pane, finds signals by their names in the whole design.
- On a scope, Add Signals (Shift+Enter) adds its own signals, and Add Signals Recursively (Ctrl+Shift+Enter) also those of the scopes below it.
- Drag signals or scopes onto the signal list.
The pane collapses with , opens again with , and resizes by its edge.
The signal list
Each row has a signal’s name and its value at the cursor. Records and arrays expand by their arrow .
- Select rows with clicks, Ctrl+click, Shift+click, and the arrow keys; Ctrl+A selects all.
- Rename a row with a double-click or F2, remove the selected rows with Delete, and reorder them by dragging.
- Resize a row by its bottom edge, or with Alt and the mouse wheel over the waveforms. This is especially useful for signals represented as analog waveforms.
- Copy, cut, and paste rows as text, one signal path per line; pasting a path or a pattern adds the signals it names.
- Filter the rows with the toolbar’s filter field : words match names, and
@value:…,@name=…,@scalar,@array, and@recordfilter by value, exact name, or kind of type; its tooltip has the details. - Undo and redo every change with Ctrl+Z and Ctrl+Shift+Z or Ctrl+Y, or with and in the toolbar.
Navigating
- Zoom with Ctrl and the mouse wheel, at the pointer; pan with Shift and the mouse wheel, or by dragging with Shift.
- shows the whole simulation; sticks to the end of a running simulation.
- Click on the waveforms or the time axis to place the cursor, and drag it.
- and move the cursor to the previous or next change of the selected signals; , with and , to the previous or next time they have a value.
- scrolls the view to a time, such as
12.5 ns; scrolls to the cursor. - shows the delta cycles at the cursor’s time side by side, and joins them again.
- Hovering over a waveform shows its value at that time; the status bar at the bottom shows the time and value under the pointer.
- Markers on the time axis show the reports of the simulation; clicking one shows its message, with a link to the source.
The time axis shows times from femtoseconds to seconds; its context menu sets the unit.
Dashboard
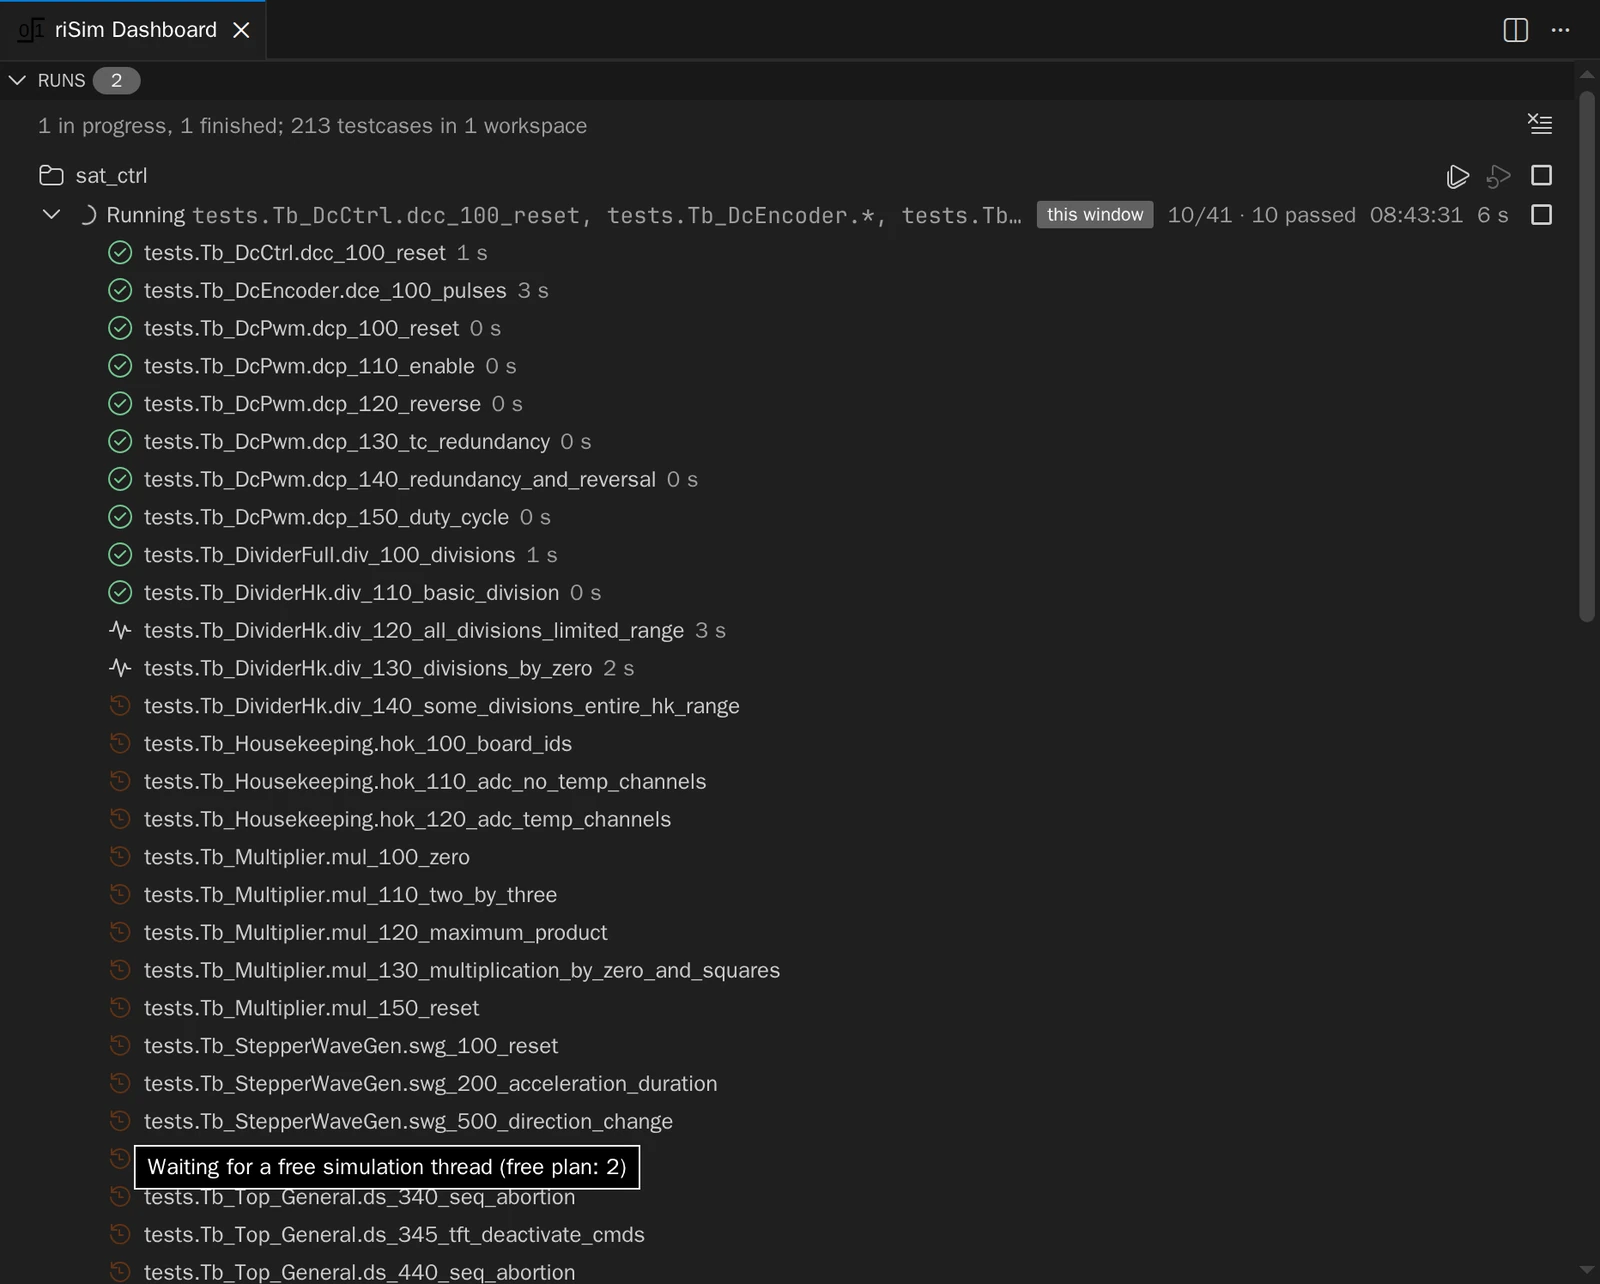
The dashboard shows an overview of the simulations within the workspaces in one place: the runs started from VS Code and from the command line, the last result of every testcase, and every simulation. Open it with in the title bar of the Testbenches sidebar, or with riSim: Open Dashboard from the command palette.
Simulation runs
A run shows its state (queued, compiling, running, or finished) and some statistics. Expanded, it lists its testcases with their states and durations.
- A testcase that waits for an available simulation thread shows a waiting icon .
- cancels a run in progress.
- on a finished simulation runs its failed testcases again.
- removes the finished runs from the list.
Simulations
The Simulations section lists every simulation, newest first.
- or , , and control it, as in a waveform view; stopping asks first.
- shows it in a waveform view.
- , on a stopped simulation, releases its data in riSim; waveform views that are open keep it.
- hides the stopped ones.
riSim versions
The extension selects the riSim version of each workspace folder by its directory overrides, its [toolchain] version (pinning a project) and the default; +<version> and RISIM_TOOLCHAIN don’t apply.
It automatically installs a pinned version that is missing.
A multi-folder VS Code workspace runs one riSim version: that of its first folder it can serve; folders that select another version are ignored. If a pinned version doesn’t work with the installed version of the extension, the extension offers to change the pin, or to install the extension’s version that matches it.
Settings
| Setting | Default | Description |
|---|---|---|
risim.simulation.threads |
cores |
The simulation threads that a run may use at once: cores (one per physical core), smt (one per logical core), or an explicit number. The number of threads is also limited by the active plan (threads). |
risim.languageServer.vhdl.enabled |
true |
Runs the riSim language server on VHDL files: errors and warnings while editing, navigation, hover and the other language features. |
risim.simulation.threads can differ per workspace folder.
Commands
These commands are in the command palette, under “riSim”:
| Command | Description |
|---|---|
| Run All Testcases | Runs every testcase of the workspace. |
| Cancel Compile and Simulations | Cancels the compiles and runs of the workspace. |
| Open Dashboard | Opens the dashboard. |
| Clear Finished Simulations | Hides the stopped simulations in the sidebar. |
| Configure Optimizations… | Chooses the optimizations for new simulations. |
| Enter License Key | Activates this machine on a license, under a name (licenses). |
| Show License | Shows the plan of this machine. |
| Install Command-Line Tools | Installs the risim command-line tools . |
| Restart Language Server | Restarts the riSim language server. |
| Show Log | Opens riSim’s log in the Output panel. |
| Reconnect to the riSim Hub | After a connection error: connects to riSim again. |
With several projects in the window, Run All Testcases and Cancel Compile and Simulations need a project: use the buttons and on its folder in the sidebar.
Troubleshooting
For license problems, see when the license isn’t used; when testcases wait, when all threads are in use. Contact support if that doesn’t solve your problem.
Logs
- The extension: the Output panel under riSim (riSim: Show Log), and under riSim Language Server for the language server.
- riSim itself: the log files of the riSim hub, in a directory per riSim version under
~/.local/state/risim/logs/on Linux and%LOCALAPPDATA%\riSim\logs\on Windows; the tooltip of the riSim item in the status bar names the directory. - A testcase: what its simulation printed, with in the Testbenches sidebar, or in the dashboard.
The Testbenches sidebar is empty
risim-config.tomlmust be at the root of a workspace folder (risim-config.toml).- The Problems panel shows the problems of the file and of the sources, such as a pattern that matches no file.
- riSim warns about an entity with the generic
runner_cfgwhose name doesn’t start withtb_or end with_tb, and about one with such a name but without the generic, which isn’t a testbench (VUnit testbenches). - A testbench with errors, such as two architectures or two testcases of the same name, is left out; its file shows the error.
With several workspace folders, a folder that pins another riSim version than the window runs isn’t served, and the sidebar says why.
VS Code can’t connect to riSim
The riSim item in the status bar shows an error sign , and its tooltip the reason. Click it, or run riSim: Reconnect to the riSim Hub, to try again. The logs should contain more information.
On Linux, riSim needs glibc 2.28 or newer: it doesn’t start on distributions older than RHEL 8, Debian 11, or Ubuntu 20.04 (requirements).